Looking to improve your customer service? Before you begin making changes to your service delivery and your staffing practices, it’s important to understand how your organization compares against industry.
Key performance indicators, or KPIs, are performance measurements that show how effectively a company is achieving its goals. KPIs can measure the success of a company’s customer service strategy, the quality and effectiveness of its support, how well its agents are performing, and more.
By focusing on the right KPIs, you can assess how smoothly your customer service operations are running or drill into specific problems. But with so many performance indicators to consider, where should you begin?
Read on to learn which live chat KPIs will be most useful to the development of your customer service team so you can optimize your live chat experience.
- Number of chats
- Agent utilization rate
- Average wait time
- Average chat time
- First contact resolution
- Invitation acceptance rate
- Sales conversion rates
- Visitor logs and wrap-up notes
- Customer satisfaction scores
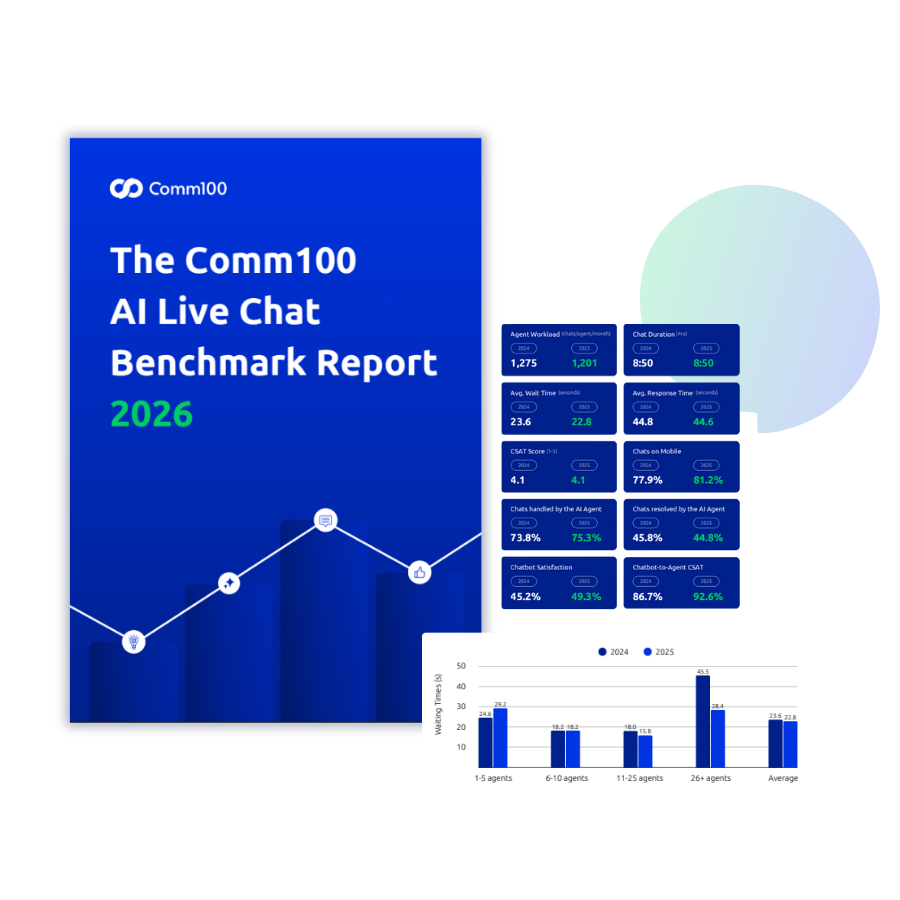
The Comm100 AI Live Chat Benchmark Report 2026
Discover the latest live chat benchmark data to understand how well your team is performing compared to the competition and where it needs to improve.
Download the report
Report
1. Number of chats
Here’s some good news: calculating the number of chats that your department has received is straight forward and can tell you a lot. Here are some things to look for with this metric:
- How many chats are agents accepting as opposed to rejecting or passing off to other agents?
Consider what the numbers reveal about agent work ethic and performance.
- Is your live chat count lower or higher than what your company is aiming for?
Ask yourself what changes could be made to your live chat experience. It’s important to consider how the visibility and placement of the live chat button may impact how many chats your company is receiving. You may also want to consider changes in marketing to generate more traffic to your website. If you want more customer engagement, consider switching to a proactive live chat strategy.
- What is your number of missed chats?
This number can show you whether your department is adequately staffed during peak times. If not, consider taking on more agents, seasonal hires, or shifting the schedule to have more agents available. A high number of missed chats may also indicate that agents are spending too much time on each chat. We’ll look more at the average handle time metric later.
- What is your number of offline chats?
If you are receiving a lot of offline messages or chat requests, consider adding to or shifting your operating hours.
You can analyze this metric by viewing your chat volume report.
2. Agent utilization rate
Agent utilization rate is the best measure of how time is being used. This key performance indicator reveals the percentage of time that agents are spending in live chats, wrap-up, and other activities, as opposed to “away” or offline.
Agent utilization rate can be measured as follows:
Amount of live chats per month x Average Handle Time / Hours worked in a month x 60 minutes
Typically, a 50-60% benchmark is good to aim for. A utilization rate that is too low might indicate problems like overstaffing and poor agent training. Similarly, a utilization rate that is too high may result in rushed chats, mistakes in documentation, negative customer feedback, and agent stress.
Consider investigating the following when studying this metric:
- How does agent occupancy compare to their utilization?
Occupancy is the percentage of time an agent spends logged in and ready for live chat. Utilization is the percentage of occupancy that agents spend working—either in a live chat or doing post-chat wrap-up work. The difference between these metrics will help you identify dips in live chat volume and problems with over staffing.
- Does your agents’ log-in time correspond with the number of hours they have worked?
By comparing both your remote and in-house agents’ log-in times, you can ensure that you have agents logged in and available when their schedules say they should be. By making sure that agents are logging in on time, you can also identify any potential need to reschedule.
- How much time are your agents spending in “away” mode?
The percentage of time that your agents are unavailable can indicate their work ethic and even a lack of team morale.
- How many chats are your agents handling at once?
Check how many chats your agents are handling simultaneously and if that amount is impacting their performance. This will help you identify any training deficiencies among agents handling a low number of chats, and can also identify problems with understaffing where this number is high.
You can check out this metric in the agent workload report.
3. Average wait time
Wait time, measuring how long visitors are waiting in the queue, has a huge impact on customer satisfaction. Nearly 80% of Americans point to speed as one of the most important elements of a positive customer experience. Average wait time is an important metric that is available in the wait time report. The wait time report shows details on the average and longest wait times within a specific time range.
Another valuable report, the queue report, shows the number of visitors who:
- Waited in the queue,
- Abandoned the queue,
- Switched to message, or
- Were refused by agents within a specific time range.
You can compare data from the wait time and queue reports to see how wait time affects visitor actions when they are waiting in the queue. If waits are long and abandonment is high, this can be a sign that you need more agents or need to increase the maximum chat allowance per agent.
If waits and/or abandonment are high during specific times of the day, consider having more agents available during the busiest hours. If the queue time fluctuates heavily with the season, consider hiring temporary agents to help tackle additional holiday traffic.
The Comm100 AI Live Chat Benchmark Report 2026
Discover the latest live chat benchmark data to understand how well your team is performing compared to the competition and where it needs to improve.
Download the report
Report
4. Average chat time
Average chat time is a measure for evaluating agent performance and refers to the average time each agent spends on a chat. By measuring average chat time, you can help enforce a speedy, concise resolution of customer issues.
The average chat time can be measured as follows:
Average chat time= (total chat time + total wrap-up time) / number of live chats handled
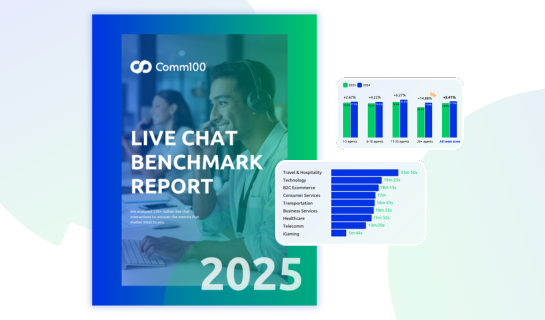
Average chat duration varies greatly by industry and by types of queries handled. We have seen some companies work with an ideal of as low as 4 minutes, and others who aim for 20! In the most recent 2025 Live Chat Benchmark Report, Comm100 users saw an average chat duration of 11 minutes 9 seconds.
Here are some additional things to consider when measuring your average chat time:
- Are you putting speed first? Speed isn’t everything.
If your live chat agents are rushing through live chat conversations simply to get customers in and out, then their needs are going to be in direct opposition to the customers’ needs. While this metric has its uses, it is important to never drive agents to value speed over issue resolution.
- Are your chats simple or complicated?
Another problem with the average chat time metric is that it does not differentiate between complex, involved cases, and simple ones. This means that it is important for you to use this metric in conjunction with an investigation into live chat transcripts, or other measures of live chat quality.
- Are your agents taking advantage of every live chat tool available to them?
Maybe your agents’ average chat time is higher than you would hope, but they are doing a great job at taking care of customer inquiries and issues. If so, ensure that your agents are trained in live chat shortcuts, canned messages, etc. to save time.
You can check this metric in the agent efficiency and the agent performance reports.
5. First contact resolution
First contact resolution, or FCR, indicates whether a customers’ issue has been resolved during their first contact with your company. In other words, this metric measures the percent of the time your agents are solving customer’s issues in a single live chat session.
Increasingly, FCR is being recognized as one of the most important metrics to watch in customer service. According to TELUS International, a study conducted by Customer Relationship Metrics found that “CSAT (customer satisfaction) ratings will be 35%-45% lower when a second call is made for the same issue.”
Making first contact resolution a priority can be extremely effective in avoiding repeat contacts and reducing queue wait times. Encouraging agents to prioritize this metric also helps increase customer satisfaction and reduces the amount of effort customers spend to find a solution.
First contact resolution can be tricky to calculate. If the issue is resolved as a transfer, does it still count as first contact resolution? The consensus is generally no. What if an agent marks a customer issue as resolved but the customer disagrees? Again, no. This discrepancy can make first contact resolution hard to measure precisely. In the end, the customer is the ultimate expert on him or herself.
One way to measure FCR effectively is to ask customers in the post-chat survey if their issue was resolved the first time. If you are relying on agents to indicate whether an issue was solved the first time, you will need to conduct periodic audits to make sure that agents are marking accurately.
6. Invitation acceptance rate
If your company uses a proactive live chat strategy, then the invitation acceptance rate metric will show you how well that strategy is working. You can measure your invitation acceptance rate with two different reports: the auto-invitation report and the manual invitation report.
The auto invitation report reveals the number of invitations triggered by predefined rules as well as the invitation acceptance rate within a set time period. The manual invitation report reveals the number of invitations sent manually by agents as well as the invitation acceptance rate for any given time period.
Consider the following when analyzing this metric:
- Are enough customers responding to your automated or manual chat invitation in general?
If your numbers are low, consider whether you are targeting the right customers and whether your default chat message is getting your website visitors to interact with you. You may also want to consider whether your proactive chat invitation is visible enough and well-designed.
- What does your chat source report tell you?
The chat source report shows how many of each chat type has been accepted and can help you gain insight on the effectiveness of your proactive chat strategy. Consider whether your manual or your automated chat invitations are more effective, and how you can target the right customers at the right time.
7. Sales conversion rates
Are you using live chat as a lead generation tool? If so, it’s good to be able to track whether your company and agent efforts are working. This number is very much influenced by your automated and manual invitation acceptance rates.
Every company’s sales conversion goal is going to be different, depending on the intensity of the proactive chat strategy. A low sales conversion rate could mean that agents need additional training in good sales and upselling practices. It could also reveal a need to revise and rework your automated and manual proactive chat invitation strategy for maximized sales capacity.
Read how HSS Hire increased sale conversions with Comm100: HSS Hire switches to Comm100 Live Chat to achieve 30% chat to conversion
8. Visitor logs and wrap-up notes
Visitor logs and wrap-up notes are important for categorizing your chats, and for adding any important details to customer cases. Agents whose visitor logs and/or wrap-up notes are left incomplete, mismarked, or excluded could cause problems in the future for customers who need to make a repeat contact.
Consider the following when studying visitor logs and wrap-up notes:
- Are your agents adding the appropriate notes and wrap-up to chats?
Perform an audit to ensure that your agents are marking their live chat messages appropriately, and not marking a junk message as an inquiry just to leave it open for 15 minutes.
- Are your agents remembering to wrap-up every time?
Wrap-up notes help you better categorize and manage your company’s live chats. This information makes it easier for you to identify any repeat issues or frequent problems with products or processes. Therefore, it is important that your agents always wrap-up a chat once it has been completed.
- What can you learn from your wrap-up composition?
What is your percentage of complaints as opposed to inquiries or suggestions? This information can help you see what area needs the most improvement.
You can analyze this information with the wrap-up report.
9. Customer satisfaction score (CSAT)
Customer satisfaction is a metric that is vital to determining the success of your live chat team and the quality of company procedures, policies, and products.
Customer satisfaction can be measured several ways. Some options include the following:
- Net promoter score – An index that measures a customer’s willingness to recommend the company’s products and services to others.
- Customer effort score – A score built by a single question survey that asks if the company made it easy for the customer to handle his or her issue.
- Loyalty score – A measure of whether customers have remained loyal to your brand or are starting to shop with the competition.
- Customer satisfaction surveys – Surveys about the customer experience delivered via post-chat pop-up, email, customer interviews, focus groups, and more.
One of the most comprehensive of measures is the post-chat customer satisfaction survey. By having agents encourage customers to take the survey, you will receive a more consistent, accurate spectrum of feedback. This is because traditionally only customers who had an especially great or awful experience will fill out a survey. This results in data that is not reflective of the entire customer service experience.
You can access the customer satisfaction survey results under the post-chat survey report. To ensure that you maximize the customers who are taking your post-chat survey, try keeping the survey short and sweet.
Read more about promoting customer satisfaction surveys: How to Create the Perfect Customer Satisfaction Survey: Questions, Tips & Templates
How to use your KPIs as part of an ongoing performance plan
Set clear expectations
For your KPIs to work as they should, your agents must first know what is expected of them. Think about what customer service values are most significant to your company and how to go about attaining them. This way you can establish which metrics—such as first contact resolution and customer satisfaction—should be emphasized as your top priorities.
Once you have identified your top priorities, make sure that you are setting expectations that aren’t in direct opposition. For example, telling agents to prioritize both quality and speed might make striking a balance tricky—what’s success on one measure is bad performance on another. This can result in role ambiguity and stress among agents.
You should also make sure the information and benchmarks that you give your agents are as clear and specific as they can be. For example, instead of telling agents to keep their average handle time “low,” tell them to keep it under fifteen minutes. An agent’s definition of low may be different from yours, and it’s best to keep things as clear as possible if you want your KPIs to be met.
Assess KPIs throughout the review cycle, not just at the end
To truly meet you goals, it is important to assess your key performance indicators throughout the review cycle, and not just at the end. This is because sometimes your agents are not thinking about what metrics they are hitting or missing—they’re just thinking about getting through the day.
Checking your KPIs periodically will help you know which areas your agents need to work on. With this knowledge, you will be able to remind your team of the goal as appropriate.
By regularly reviewing your KPIs, you will be able to catch performance slips right away. You can best catch performance slips by using the live chat reports and tools that are available.
One key auditing feature that managers have access to is live chat transcripts. By reading agent transcripts live (or right after they happen), you can track metrics such as first contact resolution rate, customer satisfaction rate, and whether average handle time is being achieved at a running pace or with quality insurance in mind.
By being attentive, you can notice any slips in the quality of agent performance and address them right away, so that customers are not affected in the future. This helps agents learn and grow by avoiding bad behavior.
Set goals going forward
Moving forward, it is important to set goals according to your KPI findings. Consider the following questions when deciding on your next steps:
- What metrics do you want to improve by your next review cycle?
- What changes need to be made to improve any of these metrics?
- Is any additional training required? If so, what sort of training, and for which agents?
- How can you get all your agents on board?
Conclusion
By keeping track of your key performance indicators, you will can provide a live chat experience that is better for your customers and more profitable for your business.
Depending on your goals, the top live chat vendors may already have these reports built out-of-the-box in their software and interface. Remember to choose the vendor that will help you track the KPIs that are important to you.
Live Chat Benchmark Report 2025
Discover the latest live chat benchmark data to understand how well your team is performing compared to the competition and where it needs to improve.
Download the report
Report
Note: This blog post was originally published in November 2017. Because it is one of our most popular posts, we have updated it to include the latest research, up-to-date statistics, and best practices in this topic.