Make Your Site Ready for Seasonal Search
It’s important to analyze your organic traffic comprehensively in order to find digital trends and spikes. The best way to start is by sitting down at looking at your Google Analytics data from the past three years.
The advantage of creating graphs based on data from the last three years is that you’ll avoid seeing many small irregularities from marketing campaigns on certain products. Basically, the more spread out your data is, the clearer you can see spikes related to seasonality. That’s why it’s advisable to compare data from a few years, not months.
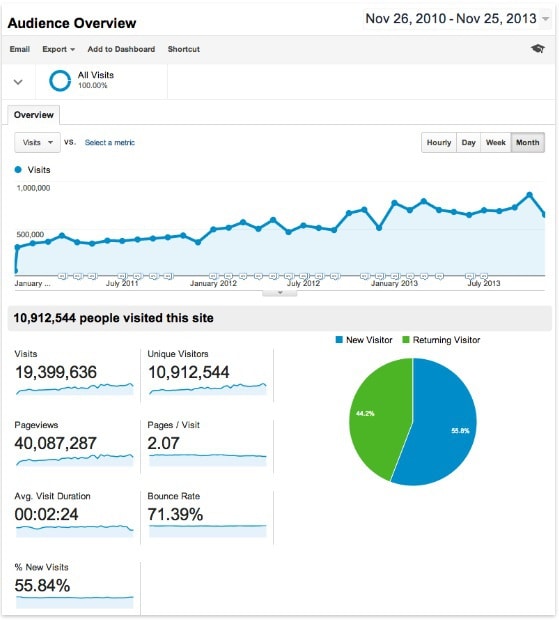
This graph from Econsultancy shows a benchmark of their past 3 years of traffic in Google Analytics, which offers a great example of how you should spread out your data in order to find seasonal spikes.
In this case, their traffic spikes are due to their well-performing content. For an ecommerce site, this would be in correlation with a certain product in demand, and seasonal spikes would have higher peaks.
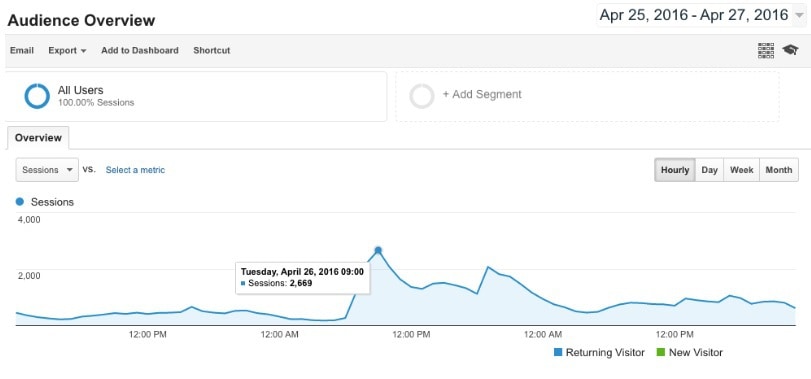
Once you find a seasonal spike, you can expand it and view the data more precisely — by setting the highest peak to an “hourly” level. This allows you to detect micro-trends that can help improve your marketing decisions.
But we’re only scratching the surface here. In order to dig deeper, go to Google Webmaster Tools (recently rebranded as Google Search Console) in the Search Queries section. Here you can find out which keywords your site is ranking for so you can better understand your seasonality. You can also use SEMrush for this.
Once you discover your strongest keywords, you can take it to the next level and analyze the monthly search volume in Google Keyword Planner. You also have this option in SEMrush as well.
The options that Google Keyword Planner shows you when searching a specific keyword are: competition, global monthly search, local monthly search and the approximate CPC (cost per click).
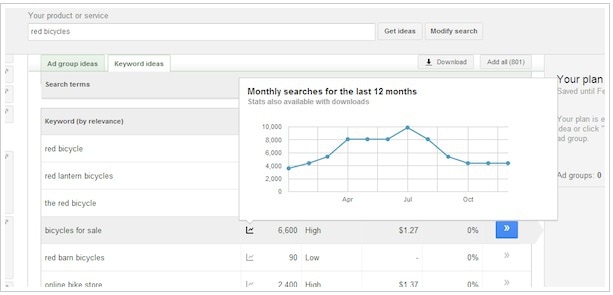
The global monthly search column shows you the average search volume globally over the last 12 months. You can notice a dramatic shift in numbers when you apply the local monthly search option, which you can adjust accordingly to a specific geographical location of interest.
The competition field doesn’t mean how competitive the keyword itself is, rather how competitive its bid is among advertisers. The CPC field shows the cost per click for an advertiser.
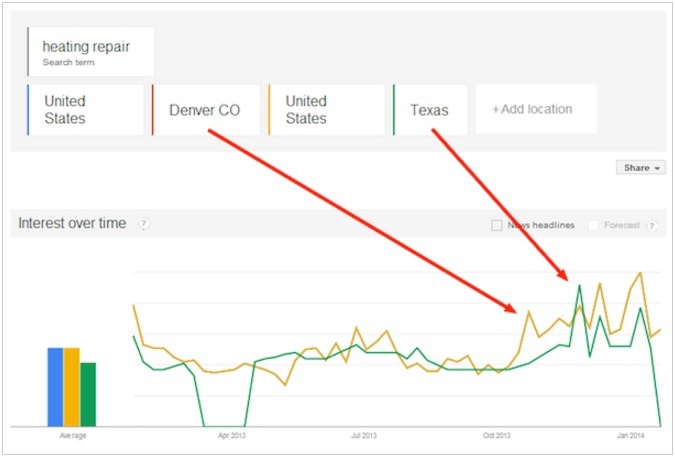
After you’ve discovered the terms associated with your seasonal spikes, you can dig even deeper with Google Trends. Here you can see which geographical locations and dates are connected with your search terms.
For instance, below you can see that the demand for the term heating repair starts earlier in Denver than in Dallas.
So what do you do with your findings? You can launch PPC ads with your researched terms that correlate with your seasonal spikes to help maximize your brand exposure.
Another effective strategy that you should implement is to showcase your products in demand on your website so that your customers can see them just in time for the trend.
The keyword research also pays off if you incorporate it into your content strategy. Try to up your blog post game by adding in naturally flowing keywords and producing high-quality content that will be of benefit to your readers. This will help make your content more searchable in search engines.
You have tons of potential customers on social media, so if you’re trying to advertise there, don’t limit yourself to just one demographic. Try asking yourself who’s interested in your product and take advantage of any seasonal events targeted to them.
For instance, if you sell beard care products, you may want to target women on Facebook for November or Valentine’s Day who are looking to buy gifts for men with beards.