Running an iGaming business is a wild ride. One minute you’re celebrating a spike in new signups, the next you’re wondering why your top players have disappeared. With customer support buzzing, compliance always lurking, and growth targets getting higher, it can feel like you’re juggling fire.
This is where the right metrics make all the difference. Not the pretty ones that sit on a dashboard looking important, but the ones that actually help you understand what’s working, what needs fixing, and where to go next.
In this piece, we’re diving into the numbers that truly matter. From game performance to player support to staying on top of compliance, you’ll get a clear picture of the KPIs every iGaming business should be watching. Let’s get into it.
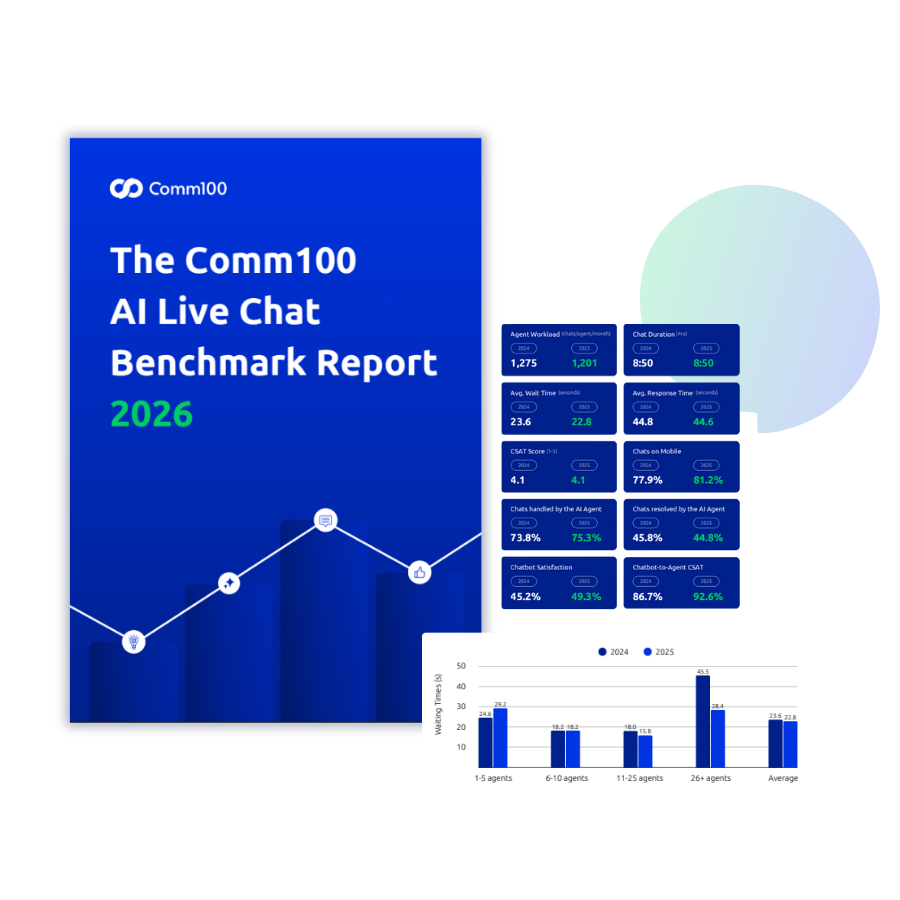
The Comm100 AI Live Chat Benchmark Report 2026
See how your support team stacks up. Discover essential benchmarks across chat volume, satisfaction, response time, and more — with insights for iGaming businesses.
Download the report
Report
| | Gaming Metrics Compliance Metrics |
| | |
| | |
| | |
| | |
| | |
| | |
| | |
| | |
| | |
| | |
| | |
| | |
| | |
| | |
| | |
| | |
| | |
Business Metrics
The following are the main metrics that would determine the overall health of your business. How much are you spending to acquire new players? What’s your churn rate? These metrics will help you tell a clear story.
1. Player Acquisition Cost (PAC)
PAC = Total Marketing Spend / Number of New Players Acquired
This tells you how much it costs to bring in each new player. If it’s higher than your average LTV, you’re burning cash. Watch this closely across different acquisition channels.
2. Lifetime Value (LTV)
LTV = Average Revenue Per User (ARPU) × Average Player Lifespan
This shows how much revenue a player brings in before they churn. Knowing your LTV helps you set safe limits for acquisition spend and guides loyalty and retention strategy.
3. Churn Rate
Churn Rate = (Players at Start of Period – Players at End of Period) / Players at Start of Period
A rising churn rate means players are leaving faster than you can replace them. This can signal issues with game design, user experience, or customer support.
4. Average Revenue Per User (ARPU)
ARPU = Total Revenue / Active Users
ARPU helps you understand the average revenue generated per active player, offering a snapshot of overall monetization performance. While useful, keep in mind that a small percentage of high-value players often drive a large share of revenue.
Use ARPU alongside player segmentation to identify underperforming segments and fine-tune your monetization strategy more effectively.
5. Net Gaming Revenue (NGR)
NGR = Gross Gaming Revenue – Bonuses – Taxes – Fees
This is your actual revenue, stripped of fluff. Focus on this number for a realistic view of financial performance.
Gaming Metrics
These metrics don’t just measure performance; they predict it. Get this right, and you’ll have the insights needed to optimize revenue, player retention, and platform growth. Want to know what keeps players coming back after their first win? This is where you start.
6. Game Session Length
Average Session Length = Total Session Time / Number of Sessions
Longer sessions often signal higher engagement but keep an eye on whether that translates into revenue or just passive play.
Remember, anything over 10 minutes suggests meaningful engagement, especially for casual slots or RNG games. For table games, the ideal game session length should be between 15-30 minutes.
7. Return to Player (RTP) Rate
RTP = (Total Winnings / Total Stakes) × 100
Operators must balance RTP to ensure fairness and profitability. Too high, and margins shrink. Too low, and players churn.
What’s good:
- 95%–96.5% for slots is a solid balance; competitive without eroding margins.
- RTPs above 97% may attract more play but watch profitability.
8. Bonus Conversion Rate
Bonus Conversion Rate = (Players Who Met Wagering Requirements / Players Who Claimed Bonuses) × 100
This shows how effective your bonus system is at driving real gameplay, not just bonus hunting. It also affects NGR and player stickiness.
What’s good:
- Above 35% suggests players are finding value in the bonus and following through with wagering.
- Below 20% may indicate unclear terms, irrelevant rewards, or abuse patterns.
9. Active Players (DAU/WAU/MAU)
DAU = Daily Active Users
WAU = Weekly Active Users
MAU = Monthly Active Users
Tracking DAU, WAU, and MAU gives you a window into how often players return. Strong DAU/MAU ratios are a good sign of product-market fit.
General activity benchmarks:
- Healthy DAU growth: 5%–10% month-over-month
- MAU churn (inactivity, account closures): Less than 15% per month is ideal
- Reactivation rate: 20%+ reactivation of dormant users through CRM campaigns is strong
10. Day 1, Day 7, and Day 30 Retention
- Healthy DAU growth: 5%–10% month-over-month
- MAU churn (inactivity, account closures): Less than 15% per month is ideal
- Reactivation rate: 20%+ reactivation of dormant users through CRM campaigns is strong
FTD volume tells you how many registrations turn into depositors. D1, D7, and D30 retention tell you how many of those depositors stick around long enough to become real revenue. Tracked together, these three numbers are the strongest leading indicator of long-term LTV in iGaming.
D1 measures whether your onboarding mechanics landed. If players don’t come back the next day, the welcome bonus, the lobby, or the first-session experience didn’t do its job. D7 measures whether your early-lifecycle CRM is doing anything; by day 7, the player has either formed a habit or moved on to a competitor. D30 is the long-game number, and the one that maps most closely to LTV.
The most useful version of this metric is segmented by acquisition source. Players from a referral campaign, an affiliate channel, and a paid social campaign retain at very different rates, and the headline number averages over patterns that retention teams need to see clearly. Operators that unify loyalty data with CRM data on a single platform consistently surface stronger insight here than those running separate stacks.
11. Game Stickiness Ratio (DAU/MAU)
Stickiness = (DAU / MAU) × 100
Stickiness measures what share of your monthly active players are also active on any given day. It’s the cleanest single metric for product-market fit. A high stickiness ratio means your platform is part of a player’s daily routine. A low one means they remember you exist but don’t habitually come back.
The ratio matters more than the absolute numbers. A platform with 10,000 MAU and 30% stickiness generates more session volume, and usually more revenue, than one with 50,000 MAU and 5% stickiness. The first platform has a habit. The second has a campaign.
Stickiness tracks particularly well with sportsbook seasonality. Operators with strong NFL, NBA, or Premier League programs see meaningful stickiness lifts during in-season periods, then have to work harder during off-season windows to keep players in the platform. Casino-led operators tend to show flatter stickiness curves but lower overall ratios.
Customer Support Metrics
Great support is a competitive edge in iGaming. The goal isn’t just speed or automation. It’s about building trust, reducing churn, and creating a service experience that feels just as polished as the games you’re offering.
These KPIs help you measure support performance across all channels, from AI agents and customer service automation to human reps, and ensure every player interaction ladders up to building loyalty.
12. First Response Time (FRT)
FRT = Time of First Agent Response – Time of Initial Player Message
This shows how long it takes your team to respond to a player’s first message. Faster response times mean higher satisfaction and fewer abandoned chats.
Ideal:
- Live chat: Under 30 seconds
- Email/ticketing: Within 1–2 hours
Fast FRTs reduce drop-offs and set a positive tone for the entire interaction.
iGaming benchmark: According to the Comm100 2026 AI Live Chat Benchmark Report, iGaming operators average 40.6 seconds for first response, faster than the cross-industry average of 44.6 seconds. At iGaming volumes (around 25,647 chats per operator per month), even a 5-second FRT improvement compounds to thousands of better-served sessions monthly. Wait time, the gap between starting a chat and an agent picking up, averages 20.2 seconds in iGaming, ahead of the cross-industry average of 22.8 seconds.
13. Average Resolution Time (ART)
ART = Total Time to Resolve All Tickets / Number of Resolved Tickets
Tracks how long it takes, on average, to fully resolve a player issue. High ART can indicate process inefficiencies or complex handoffs.
Ideal:
- Live chat: Under 15 minutes
- Email/tickets: Within 4–6 hours for standard tickets
Lower ART suggests smoother processes and fewer unnecessary handoffs.
iGaming benchmark: The Comm100 2026 AI Live Chat Benchmark Report shows iGaming chat duration averaging 6 minutes 1 second, the shortest of any industry tracked. The cross-industry average is 8 minutes 50 seconds. iGaming queries (balance checks, bonus questions, quick account fixes) tend to be transactional, which is why iGaming agents handle roughly 1,540 chats per month against the cross-industry average of 1,201. Compare this to banking (13 minutes per chat, 214 chats per agent monthly) and the structural difference becomes clear: iGaming is built for high-volume short-form support.
Streamline Support with Ticketing & Messaging
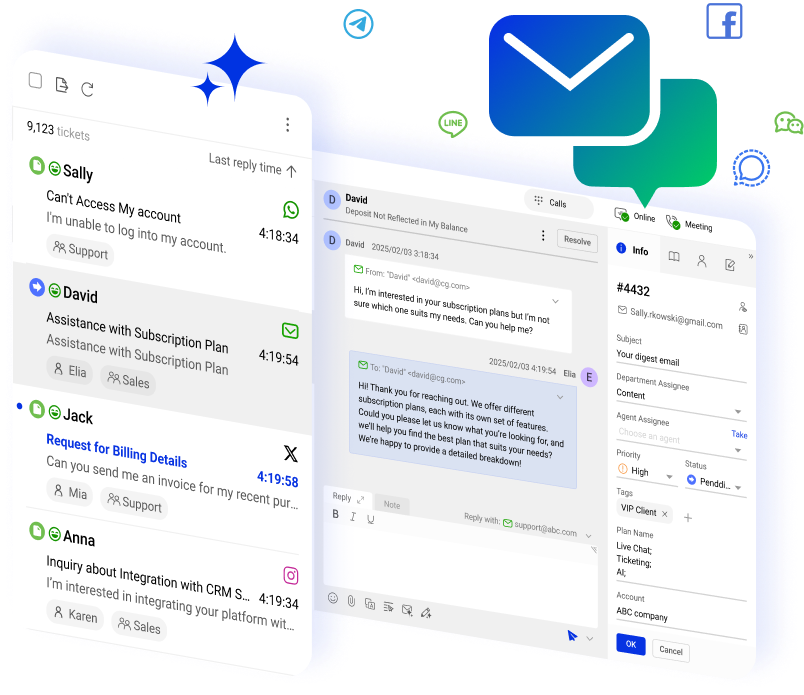
Reduce resolution times and improve team efficiency with Comm100’s unified Ticketing & Messaging platform — built for fast, seamless player support.
Learn more
Solution
FCR = (Tickets Resolved on First Contact / Total Tickets) × 100
Measures how often issues are resolved in a single interaction. High FCR means fewer follow-ups and happier players.
Ideal:
- 70%–80% is considered strong
- Over 85% is excellent
High FCR means fewer follow-ups, higher satisfaction, and reduced workload.
15. Customer Satisfaction (CSAT) Score
CSAT = (Positive Survey Responses / Total Responses) × 100
Tells you how players rate their support experience, usually after a chat or ticket. A quick gut-check for player happiness.
Ideal:
- 85%–90%+
Anything above 90% is a sign your support is delivering consistently positive experiences.
Cross-industry benchmark: CSAT averaged 4.1 out of 5 in the Comm100 2026 AI Live Chat Benchmark Report, holding steady year over year despite AI agents now handling 75.3% of all chats. The chatbot-to-agent handoff satisfaction rate climbed to 92.6%, up from 86.7%, suggesting the friction that historically came with bot-to-human transfers has largely been engineered out.
16. Escalation Rate (AI to Human)
Escalation Rate = (AI Interactions Escalated to Agents / Total AI Interactions) × 100
Measures how often your AI needs to hand off a player to a human. High rates suggest your bot is undertrained or misrouted. You can improve it by refining intent recognition and escalation triggers.
Ideal:
- 20%–40%, depending on AI agent design and coverage.
High escalation may point to gaps in AI agent training or unclear intent detection.
17. Live Chat Response Time
Live Chat FRT = Sum of First Responses in Chat / Number of Chats
Calculates average wait time in live chat. This gives you the average time it takes for an agent to respond to the initial message in a chat session.
Ideal:
- Under 30 seconds
Beyond one minute, abandonment risk increases, especially for mobile users.
18. Ticket Volume by Channel
Segment total ticket volume by source: chat, email, AI handoffs, mobile, in-game
Helps you understand where support demand is coming from. Useful for resourcing and identifying gaps in automation.
19. Resolution Rate
Resolution Rate = (Resolved Tickets / Total Tickets) × 100
Tells you how many issues are getting fully resolved. Low rates can point to unclear responses or missed follow-ups. Improve it by implementing ticket status tracking and automated follow-ups.
Ideal:
- 90%–95%+. Lower rates suggest broken handoff processes or poor documentation.
20. Agent Utilization Rate
Utilization = (Time Spent on Support Tasks / Total Scheduled Time) × 100
Measures how efficiently your agents’ time is being used. Under or over-utilization both impact team morale and performance.
Ideal:
- 70%–85%
Below 60% may indicate underutilization; above 90% risks burnout. The sweet spot balances productivity and breathing room.
Unlock Agent Efficiency with AI Insights
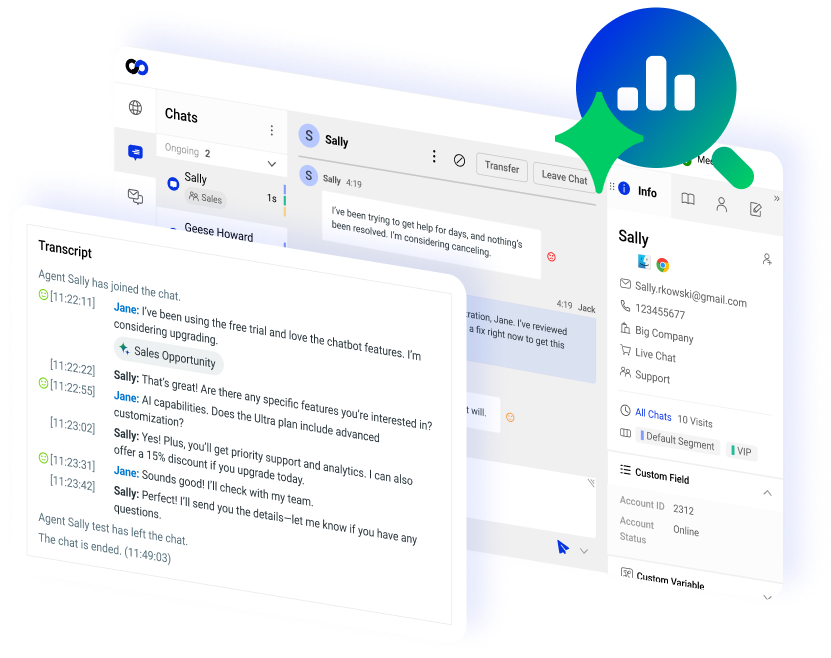
Discover how AI Insights helps you balance agent workload, boost productivity, and prevent burnout with detailed performance analytics.
Learn more
Solution
21. Interactions per Ticket
Average = Total Interactions / Total Tickets
Shows how many back-and-forth messages it takes to solve a problem. Fewer is better; players want quick, clear answers.
Ideal:
- 1.2 to 1.6 interactions per ticket for well-optimized workflows.
Fewer touchpoints = clearer answers and more efficient communication.
Support Cost = Total Support Ops Cost / Total Support Interactions
Reveals how much you’re spending to resolve each player issue. Helps assess the ROI of automation and agent efficiency.
Ideal:
Varies by region and staffing model, but generally:
- $1–3 per AI-resolved interaction
- $5–10 per live agent chat
- $10–25 per email/ticket
Use this metric to justify AI investment and streamline human workflows.
23. Missed Chat Rate
Missed Chats = (Unanswered Chat Requests / Total Chat Requests) × 100
Tells you how many players didn’t get a response when they reached out via live chat. A major red flag for player trust. Ideally, it should be under 3%.
However, if you’re using an AI Agent, you don’t have to worry about any missed chats. The AI Agent serves as the first tier of support, answering questions and escalating chats if necessary.
Experience the Comm100 AI Agent
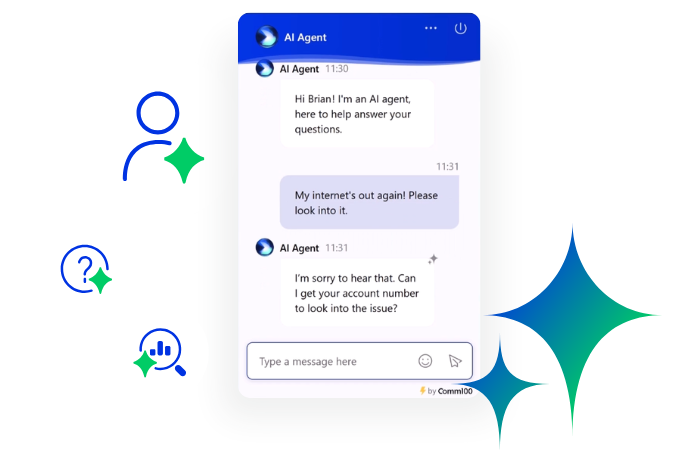
Never miss a chat again. See how the Comm100 AI Agent handles player questions instantly, boosting trust and freeing your team to focus on complex issues.
Learn more
Solution
NPS = % Promoters – % Detractors
Captures how likely players are to recommend your platform based on their support experience. Strong predictor of long-term loyalty.
Ideal:
- +30 to +50 is good
- +50 to +70 is great
Higher NPS correlates with stronger brand trust and retention.
25. SLA Compliance Rate
SLA Compliance = (Tickets Resolved Within SLA / Total Tickets) × 100
Monitors how well your team is meeting promised resolution or response times. Critical for VIP player management and B2B agreements. Ideally, it should be above 95%.
26. Chat Abandonment Rate
Chat Abandonment Rate = (Chats Left Before Agent Connection / Total Chat Requests) × 100
Chat abandonment measures players who initiated a chat, waited, and disconnected before being served. It’s distinct from a missed chat — abandonment is a wait-time problem first and a routing problem second. In iGaming, abandonment spikes during peak periods (major sporting events, weekend evenings, post-promotion windows) when the staffing model wasn’t built to absorb the volume.
The Comm100 2026 AI Live Chat Benchmark Report shows iGaming wait times averaging 20.2 seconds, ahead of the cross-industry average of 22.8 seconds. Strong wait time numbers translate directly into lower abandonment, but every additional second compounds across the roughly 25,647 monthly chats per operator that the report tracks.
AI agents reduce abandonment toward zero by serving a first response immediately and escalating in the background. Operators with mature AI deployments rarely see this metric show up as a problem, because there’s no wait period long enough for a player to give up on.
27. SVIP Response Time SLA
VIP SLA Compliance = (VIP Tickets Meeting VIP-Specific SLA / Total VIP Tickets) × 100
Most operators run a separate, faster SLA for VIPs and high-rollers. A small share of players drives a large share of revenue, and missing a VIP SLA carries an outsized churn cost. Track this independently from your overall SLA compliance — averaging the two together hides exactly the data your VIP program needs to see.
Comm100’s joint survey with SBC Media of sportsbook and iGaming operators worldwide found that 78.3% of operators are comfortable letting AI handle casual player interactions, but only 17.4% would let AI handle VIP support. That gap reflects a real operational reality: VIPs expect a known, named human host on the other end of the conversation, and the cost of getting it wrong is high enough that most operators don’t take the risk.
Build escalation paths that route VIPs to a human fast, regardless of how well your AI agent is performing on the rest of the queue. Pair this metric with VIP CSAT, which most operators benchmark separately from the general player base.
28. AI Handling Rate vs. AI Resolution Rate
- AI Handling Rate = (Chats Touched by AI / Total Chats) × 100
- AI Resolution Rate = (Chats Fully Resolved by AI Without Human Involvement / Total Chats) × 100
Handling rate tells you how often the AI agent picked up the conversation. Resolution rate tells you how often the AI actually closed it without a human stepping in. The gap between the two is where the real ROI conversation lives, since only fully resolved chats represent true cost avoidance — a handed-off conversation still consumes agent time.
According to the Comm100 2026 AI Live Chat Benchmark Report, AI agents handle 75.3% of all incoming chats across industries, but only 44.8% are fully resolved without human involvement. iGaming sits at 38.1% resolution, lower than education (75.9%) or banking (75.2%), because player queries are often context-heavy: payment disputes, bonus interpretation, account holds, KYC questions. These aren’t AI failures so much as honest reflections of which queries are genuinely automatable.
Track the chatbot-to-agent handoff CSAT alongside resolution rate. The Comm100 2026 Report puts this at 92.6% across industries, up from 86.7% the prior year, suggesting the friction that historically came with bot-to-human transfers is largely engineered out at this point.
Compliance and Risk Management Metrics
Compliance and risk management constitute the foundation of your license, your trust with players, and your long-term viability.
Whether it’s preventing fraud or promoting responsible play, these metrics keep you operating legally, ethically, and competitively.
29. KYC Completion Rate
KYC Completion Rate = (Verified Accounts / Total Accounts Required to Verify) × 100
Shows how effectively players are completing identity verification. A low rate may signal friction in your onboarding process.
Ideally, you’d want this to be between 85%-95%. Lower rates may indicate friction in the onboarding flow (e.g., unclear steps or unsupported ID formats).
30. Self-Exclusion Rate
Self-Exclusion Rate = (Number of Self-Excluded Players / Total Active Players) × 100
Tracks how many players voluntarily exclude themselves from gameplay due to potential harm. Higher rates can indicate responsible gambling tools are being used—but may also reflect overexposure.
Anywhere between 1-5% is good. Higher rates may reflect strong Responsible Gambling (RG) tool visibility or marketing overexposure.
31. Breach Incident Count
Total Number of Compliance or Data Breaches in a Defined Time Period
Captures how often your business faces regulatory or data privacy breaches. These are serious events that can trigger fines or suspension. The industry expectation is usually 0.
32. Fraud Detection Rate
Fraud Detection Rate = (Flagged Fraudulent Transactions / Total Transactions) × 100
Measures how many suspicious activities your system flags. It helps quantify your ability to detect bonus abuse, identity theft, or payment fraud. It should be around 0.2-1.5% of all transactions.
33. Chargeback Rate
Chargeback Rate = (Number of Chargebacks / Total Transactions) × 100
High chargeback rates suggest payment disputes, which can damage your merchant account reputation. Keep it between 0.1-1% of total transactions.
34. AML Alert Rate (Anti-Money Laundering)
AML Alert Rate = (Flagged Transactions for AML Review / Total Transactions) × 100
Should be between 0.1-1% of all transactions. Tells you how frequently your AML system is identifying risky or unusual transactions. Important for identifying structured deposits or laundering activity.
35. Bonus Abuse Rate
Bonus Abuse Rate = (Abuse Incidents / Total Bonuses Issued) × 100
Tracks how often bonuses are exploited through duplicate accounts, bots, or collusion. A high rate dilutes the ROI of your promotions. Try to keep it under 2% of total bonuses issued.
36. Regulatory SLA Compliance Rate
Regulatory SLA Compliance = (Number of Required Actions Taken on Time / Total Required Actions) × 100
Measures whether your platform meets time-bound compliance duties—like reporting suspicious activity or updating audit logs. Ideally, should be between 98-100%.
37. Inactive Account Purge Rate
Inactive Account Purge Rate = (Dormant Accounts Archived or Removed / Total Inactive Accounts) × 100
Regulators often require regular purging of unused accounts. This metric ensures compliance with data retention laws. In an ideal scenario, your purge rate should be 100% of qualifying accounts within the regulatory retention period (12–24 months).
Tool Usage Rate = (Users Who Set Limits / Total Active Users) × 100
Indicates how many players are proactively using tools like deposit limits, session timers, and reality checks. A rising rate reflects player awareness and RG effectiveness. Keep it between 10-20% of all active players.
39. Risk-Based Player Segmentation Ratio
Risk-based player Segmentation Ratio = High-Risk Players / Total Player Base
Helps identify what portion of your users fall into risk-based categories (e.g. flagged for RG concerns, fraud watch, or AML patterns).
Your segmentation ratio should be between 3-10%. Too low may signal under-detection. Too high may flag over-sensitivity in models.
40. Source of Wealth / Source of Funds Documentation Rate
SoW Documentation Rate = (High-Deposit Players with Documented SoW / Total Players Above Regulatory Threshold) × 100
Regulators in the UK, Sweden, the Netherlands, and several Canadian provinces require documented source of wealth and source of funds for players above defined deposit thresholds. The thresholds and documentation requirements vary by jurisdiction, but the principle is consistent: above a certain level of player activity, the operator needs to know where the money is coming from and have evidence on file.
A low documentation rate is an audit finding waiting to happen. Track this as a hard compliance KPI, not a soft one — if your team treats it as a target to improve toward, you’re already behind. The standard operating model is to gate continued play above the threshold on completed documentation, rather than collecting it retrospectively.
Pair this metric with KYC Completion Rate. The two are closely related: KYC verifies who the player is; SoW verifies where their money comes from. Reading them together gives a complete picture of how prepared the operation is for the audits that follow major regulatory enforcement cycles.
41. Time-to-Self-Exclusion-Honour
Time-to-Self-Exclusion-Honour = Time from player request to full system-wide enforcement (login, marketing, deposits, push notifications, affiliate retargeting)
Self-Exclusion Rate (the existing metric in this article) tells you how many players opt out. This metric tells you how quickly your systems actually honour that opt-out across every touchpoint. Even a few hours of delay can trigger fines, and regulators audit this aggressively because it’s one of the most straightforward enforcement actions to bring.
The hardest part of measuring this is that the slowest link is usually a marketing or CRM system that wasn’t designed with self-exclusion in mind. The player gets blocked from logging in instantly, but a marketing email batch queued an hour earlier still goes out the next morning. Track each system independently to identify where the breakdown actually happens.
The headline number hides which system is failing, and the failing system is the one that gets cited in audits. Operators that run consolidated player data across the platform — rather than syncing across stacks — consistently show faster honour times because the opt-out flag propagates from a single source of truth.
Which Metrics Should You Prioritize?
Now, we understand that given resource constraints, not every business would be able to accurately track all of these metrics. Naturally, you should start by prioritizing business metrics, as they speak to the overall health of your company.
The following KPIs help you identify what’s working, where you’re losing value, and how to stay compliant without stretching your team too thin. Start here:
Revenue & Profitability
- Lifetime Value (LTV)
Guides how much you can afford to spend acquiring and retaining players.
- Net Gaming Revenue (NGR)
Your most honest revenue number, after taxes, fees, and bonuses.
- Average Revenue Per User (ARPU)
Helps you identify your most valuable player segments.
- 1.2 to 1.6 interactions per ticket for well-optimized workflows.
Fewer touchpoints = clearer answers and more efficient communication.
Retention & Engagement
- Churn Rate
Rising churn is a red flag. You can’t afford to lose more players than you’re bringing in.
- D30 Retention
Isolates the cohort that actually converted to depositors
- Game Stickiness Ratio (DAU/MAU)
Tells you whether those players are forming a habit or just turning up occasionally.
Support & Efficiency
- First Response Time (FRT)
Fast replies = fewer abandonments and higher CSAT.
- First Contact Resolution (FCR) Rate
Reduces repeat work and keeps players satisfied.
- AI Resolution Rate
More AI-resolved inquiries reduce costs while maintaining service quality.
- VIP Response Time SLA
Rapid support for VIP players helps protect your most valuable revenue streams.
Compliance & Risk
- KYC Completion Rate
Friction here kills onboarding. Monitor this constantly.
- SoW/SoF Documentation Rate
Complete documentation supports compliance and reduces regulatory risk.
- Time-to-Self-Exclusion-Honour
Faster enforcement protects players and strengthens compliance.
Know Your Numbers
Success in iGaming isn’t just about having great games or flashy bonuses. It’s about understanding what’s really happening behind the scenes. The right metrics help you see where players are engaging, where they’re dropping off, and how your support and compliance efforts are holding up.
When you track what matters, you make smarter decisions. You catch problems early, spot new opportunities, and build a better experience for your players. Whether you’re trying to boost revenue, improve retention, or keep regulators happy, these KPIs give you the clarity to move with confidence.
Start measuring what counts and let your data guide the way forward.
The Comm100 AI Live Chat Benchmark Report 2026
Want to see how your metrics stack up? Get the latest industry-wide live chat benchmarks to uncover performance gaps and growth opportunities.
Download the report
Report